.png)
Panel
Dashboard
Understand Dashboard widgets, date filters, platform breakdown, and layout editing
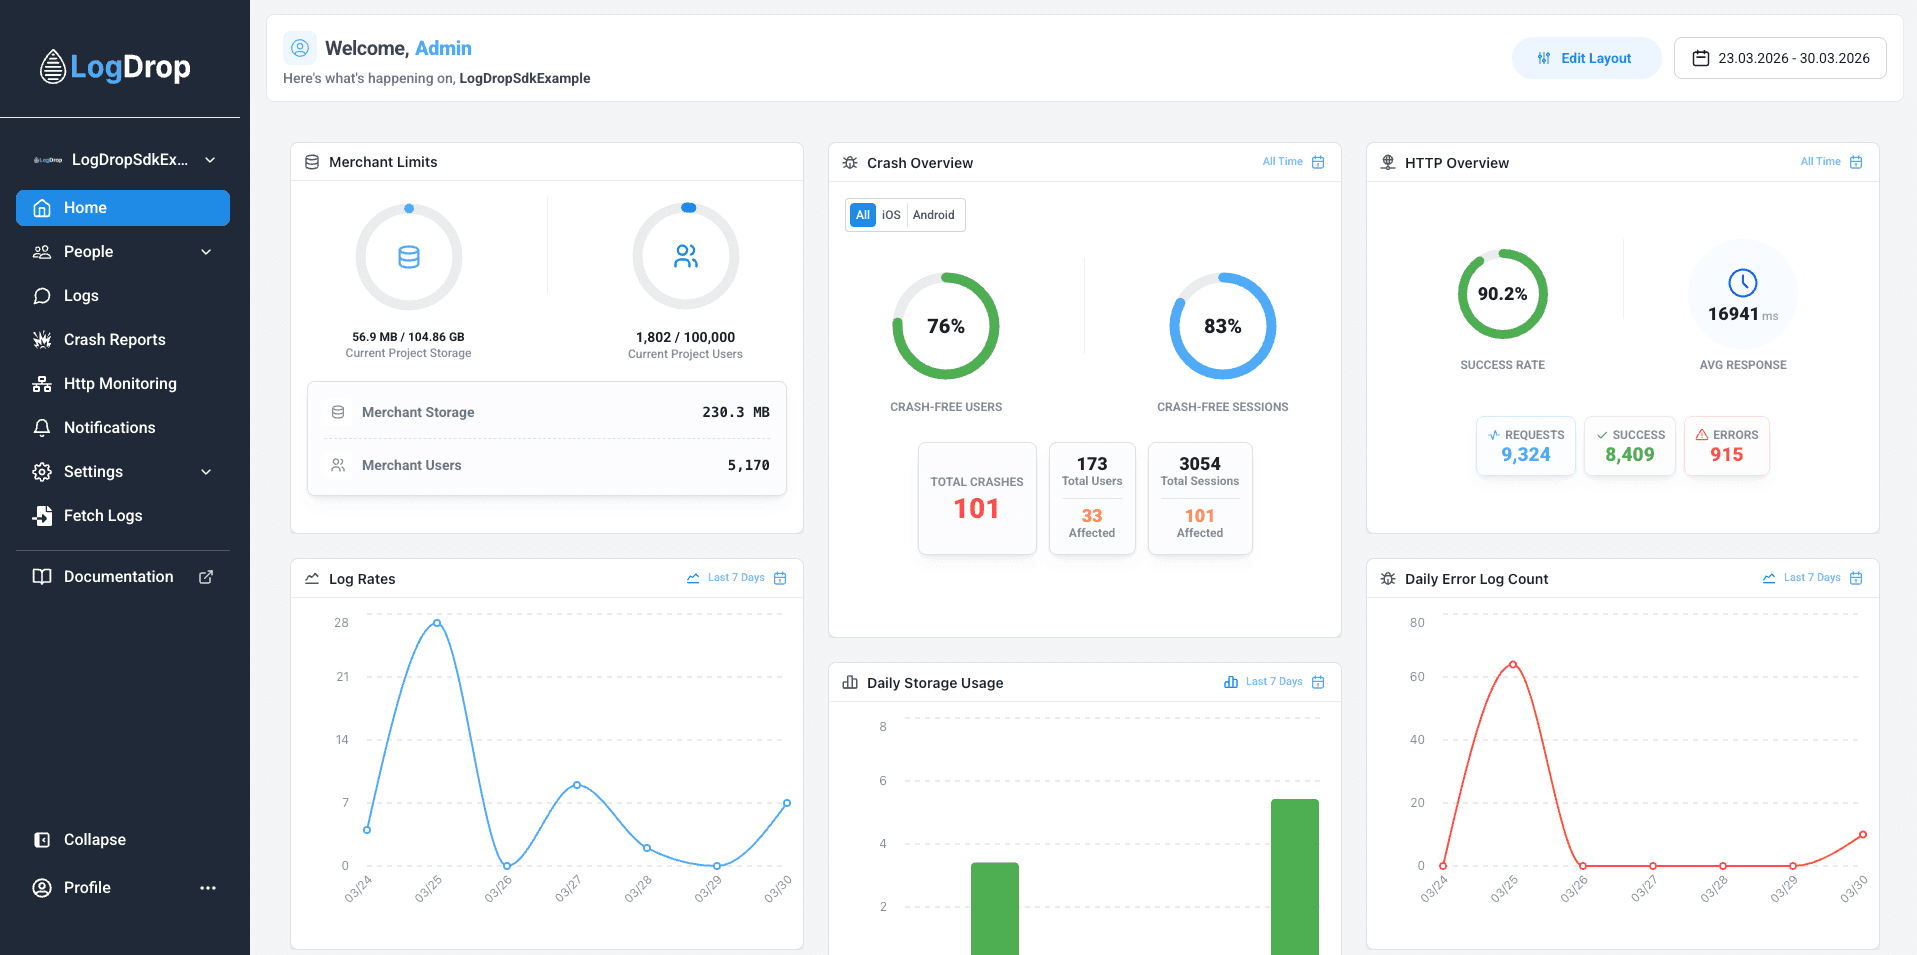
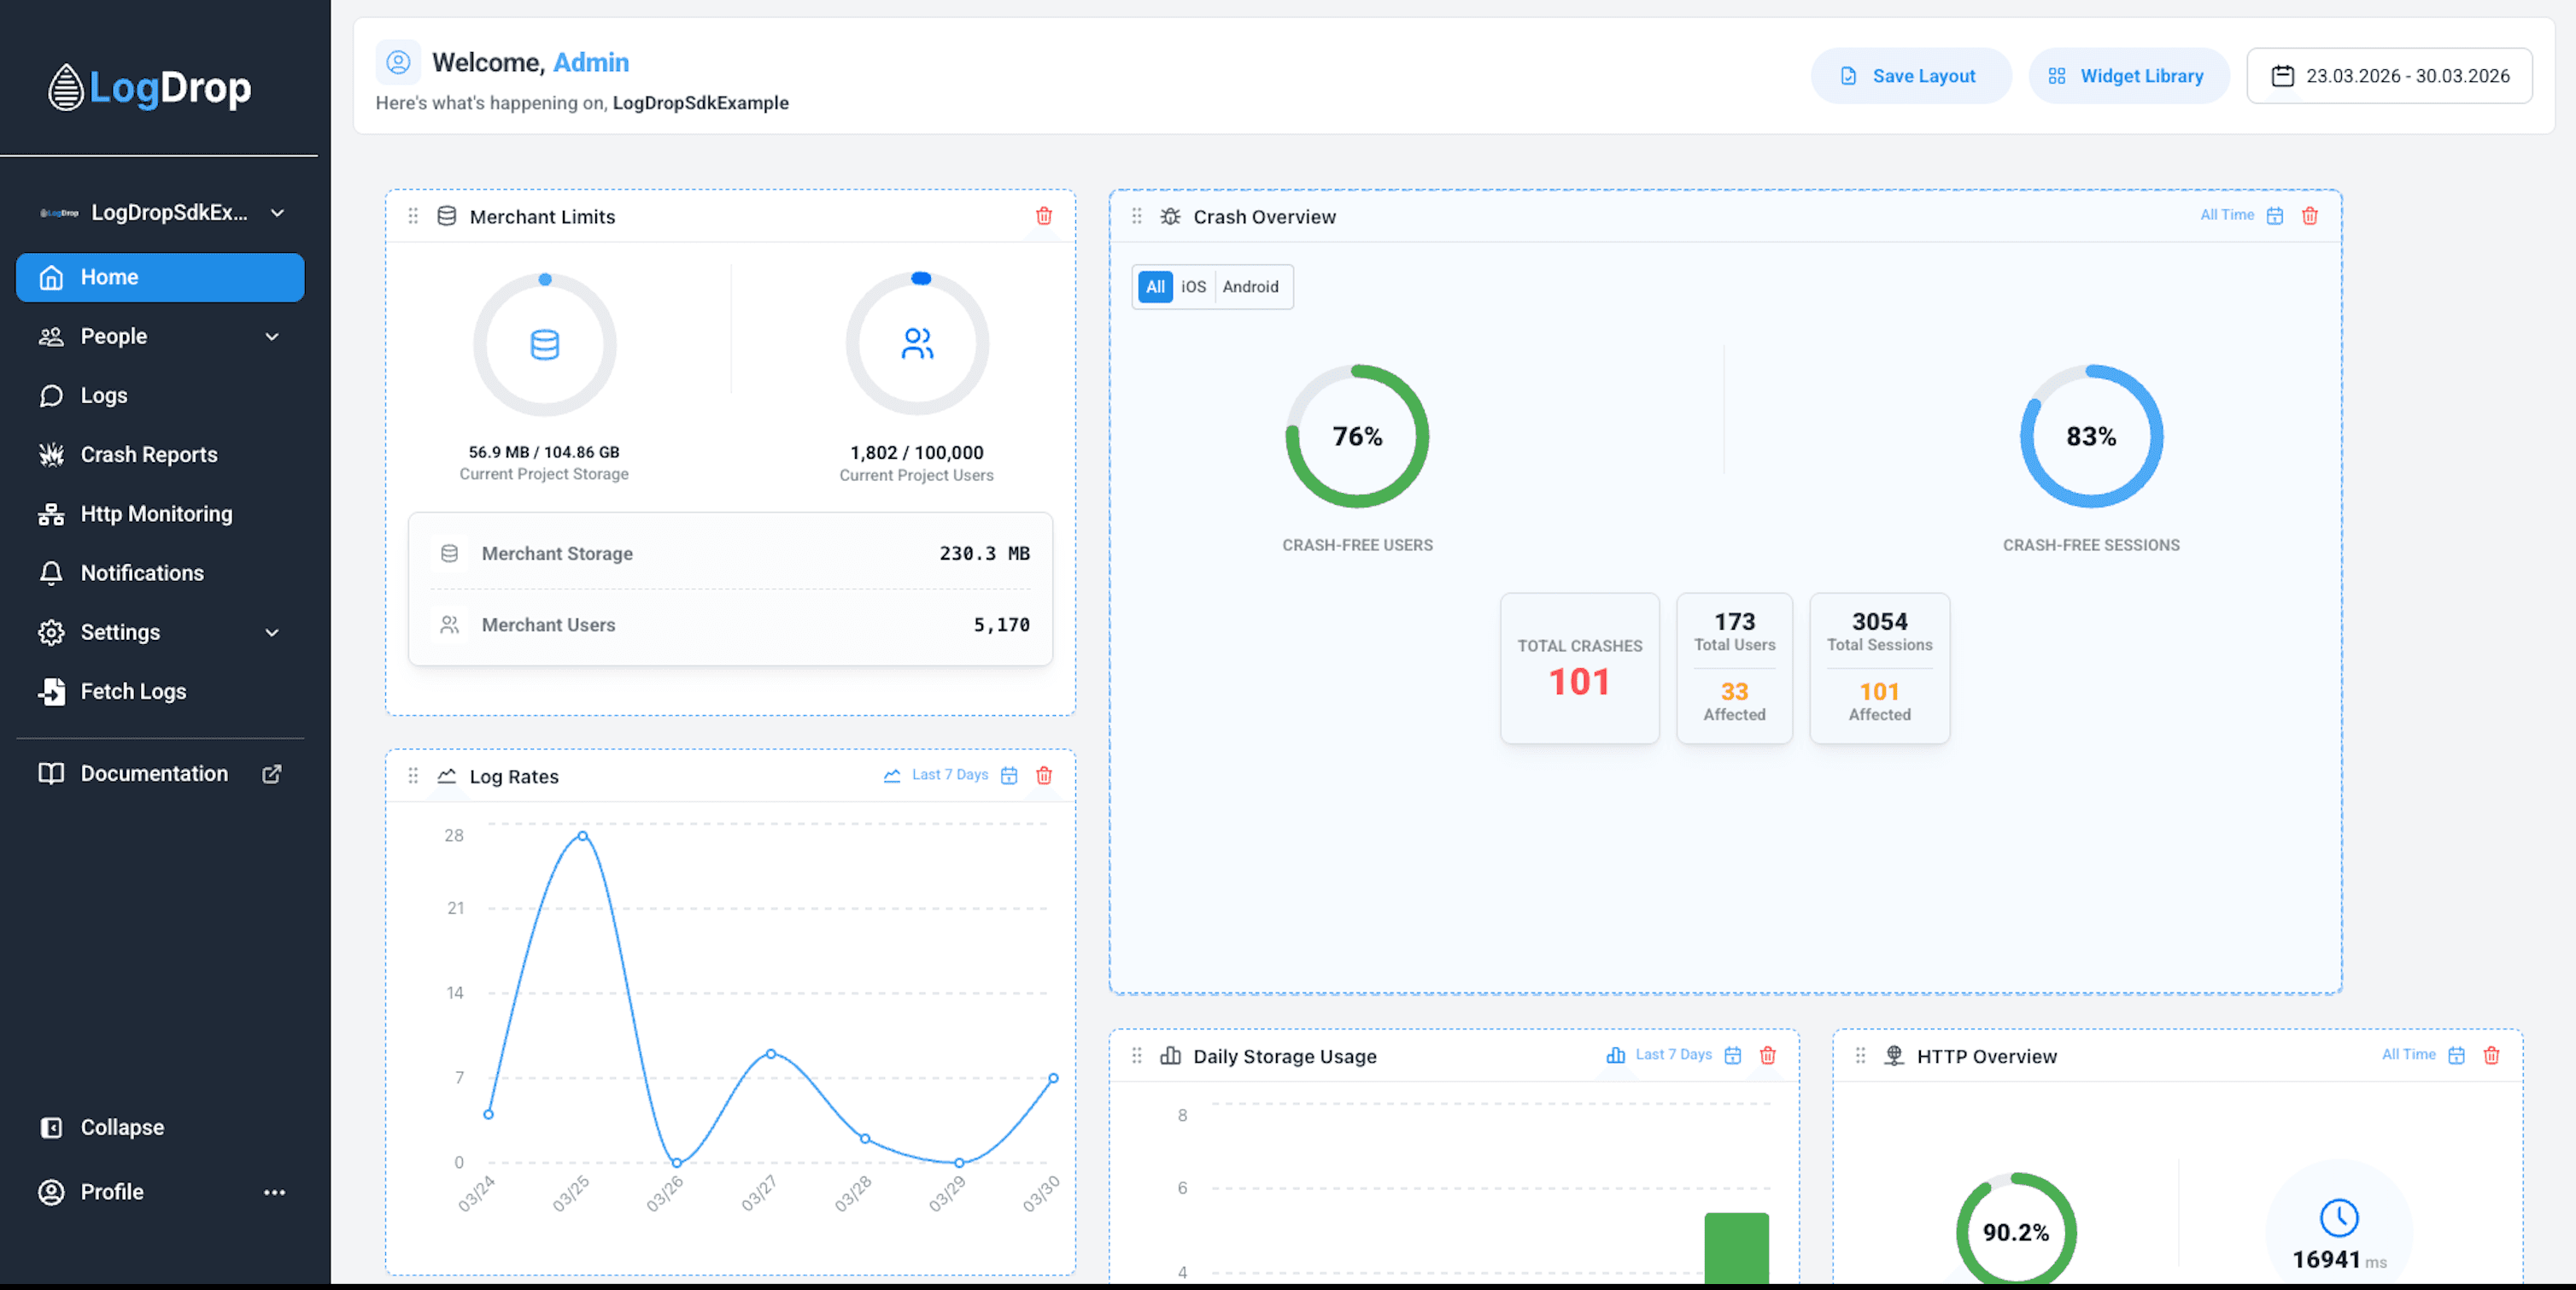
The Dashboard provides a high-level overview of your project health. You can monitor key metrics via widgets, filter by date and platform, and customize the layout per user.
1) Dashboard overview
- Open Dashboard from the left navigation.
- Use widgets to track logs, crashes, HTTP performance, storage, and device distributions.
- Drill down to deeper pages (Devices, Logs, Crashes, HTTP Monitoring) when you detect anomalies.
Screenshot: Dashboard overview
2) Date range filters
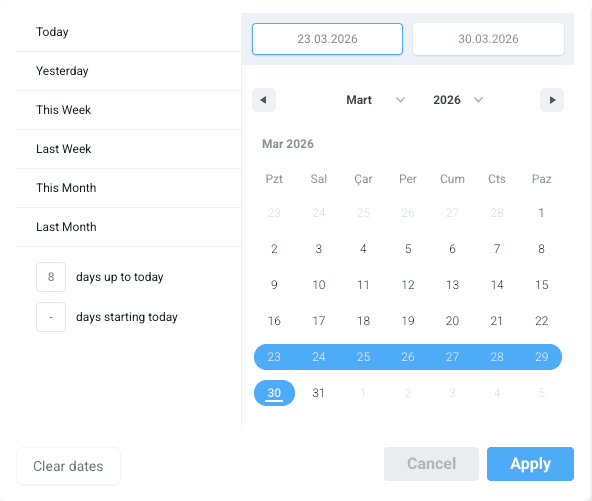
Dashboard supports global date ranges (e.g., Today, Yesterday, Last 7/30/90 Days). Some widgets can also use their own date range independently from the global filter.
Screenshot: Global date range selector
3) Platform breakdown (All / iOS / Android)
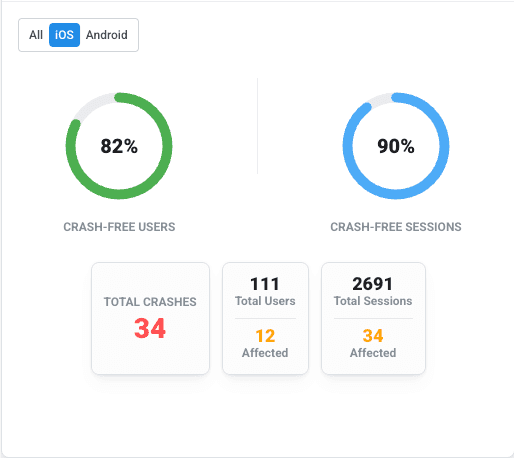
Use platform breakdown where available to compare metrics across iOS and Android and spot platform-specific issues.
Screenshot: Platform filter
4) Widget Library & Edit Layout
- Open Widget Library to add or remove widgets.
- Click Edit Layout to rearrange widgets (drag & drop).
- Resize widgets if supported and save your layout changes.
Screenshot: Widget Library
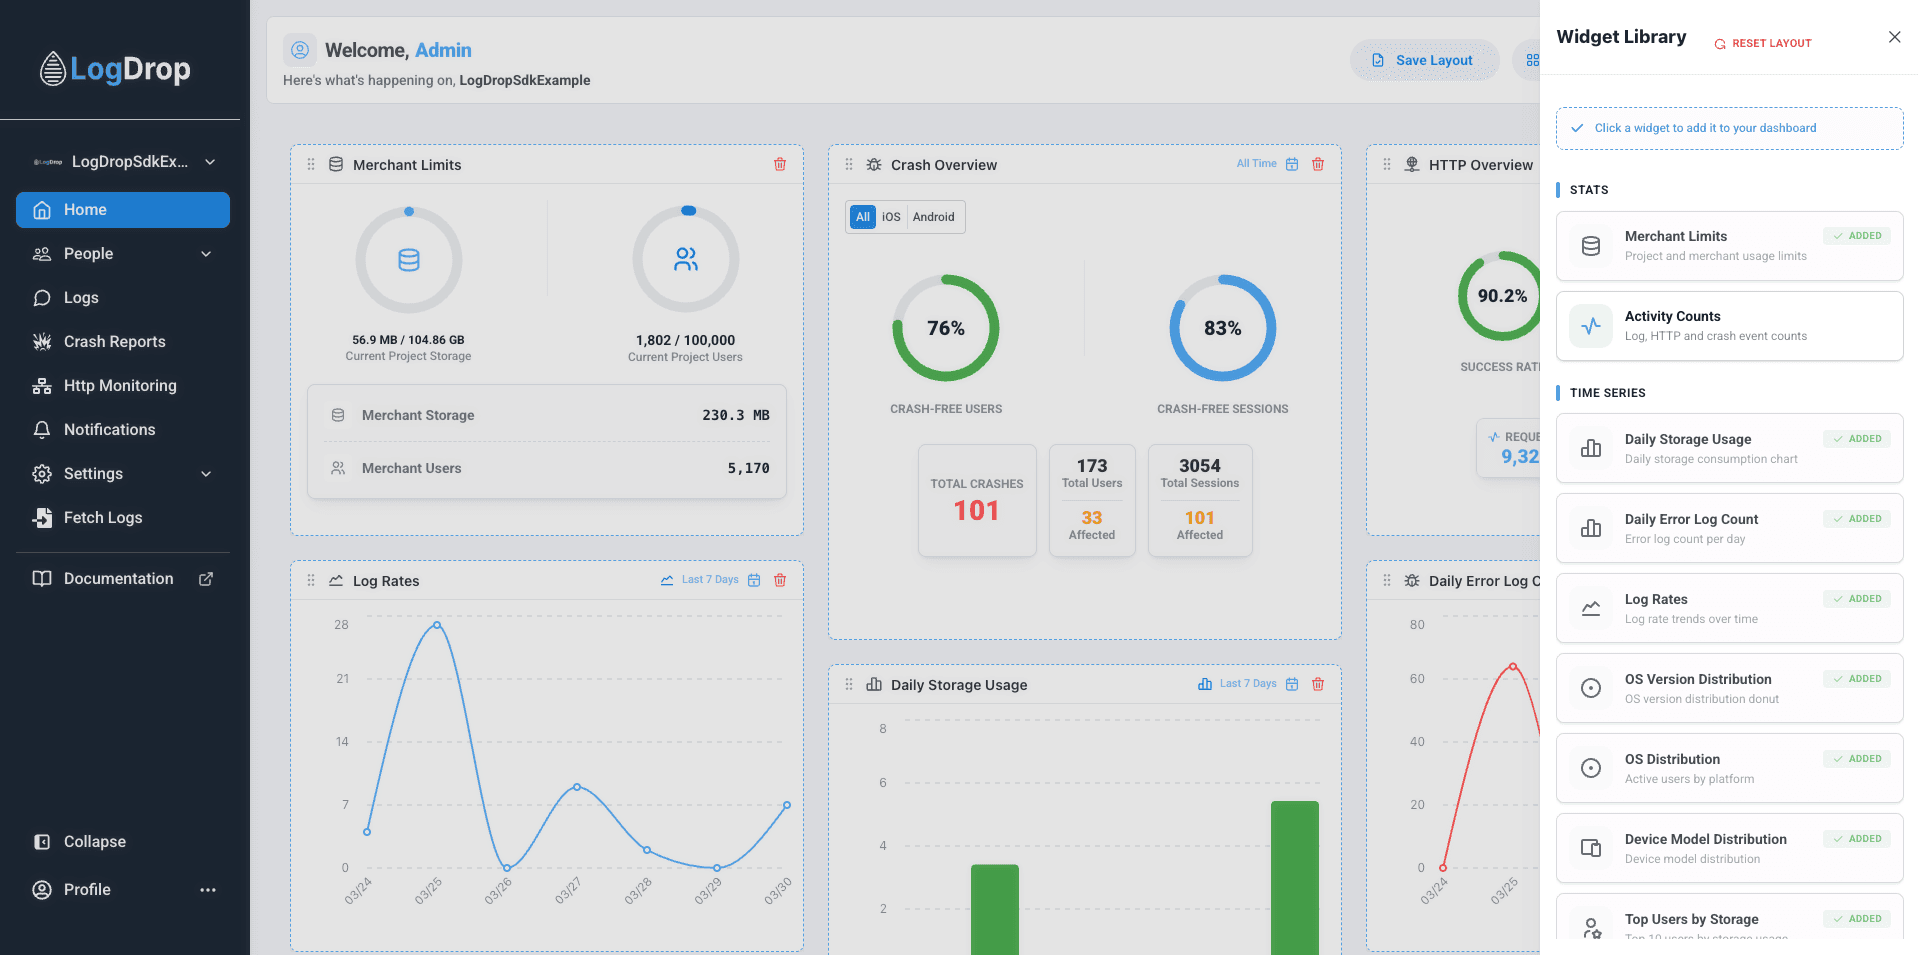
Screenshot: Edit Layout (drag & drop)
5) Chart types (Bar / Line / Area)
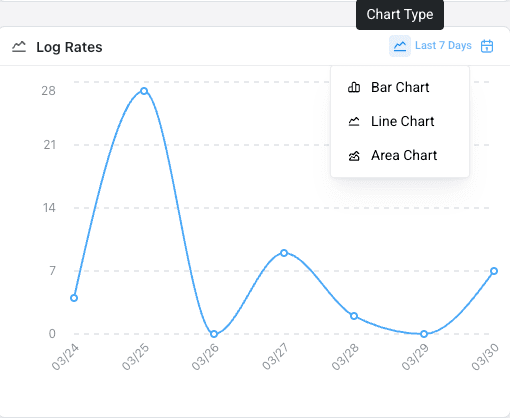
Chart-based widgets may support switching between bar, line, and area charts for readability.
Screenshot: Chart type toggle
6) Common widgets (what they mean)
- Crash Overview: Crash-free users/sessions, total crashes, affected users/sessions.
- HTTP Overview: Success rate, average response time, request volume, errors.
- Log Rates / Daily Error Logs: Spikes usually indicate new bugs or loops.
- Daily Storage Usage: Helps detect abnormal increases in stored logs.
- Device / OS Distributions: Understand your user base and fragmentation.
Tip: If you see an anomaly on Dashboard, jump directly to: Logs, Crashes, or HTTP Monitoring.