.png)
Crash Reports
Track crash issues, filter by platform/version/model, and manage issue status
Crash Reports helps you monitor and manage crash issues across iOS and Android. Use filters to isolate the impacted segment, review trends and affected users/sessions, and open a crash to analyze stack traces and AI summaries.
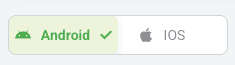
1) Platform tabs (iOS / Android)
Use platform tabs to focus on crashes for a single platform or compare patterns across platforms.
Screenshot: Platform tabs
2) Filters (OS / Device Model / App Version)
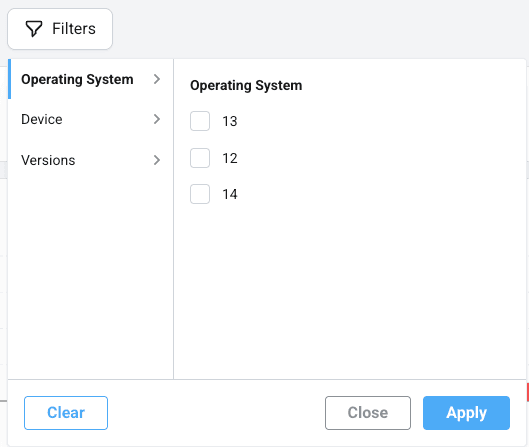
Filters help you narrow down the crash list to the most relevant cohort—especially useful after releases or OS updates.
- OS Version – find OS-specific regressions
- Device Model – detect device-specific issues
- App Version – validate release impact
- Status (Open / Closed) – manage issue lifecycle
Screenshot: Filters section
3) Summary metrics & charts
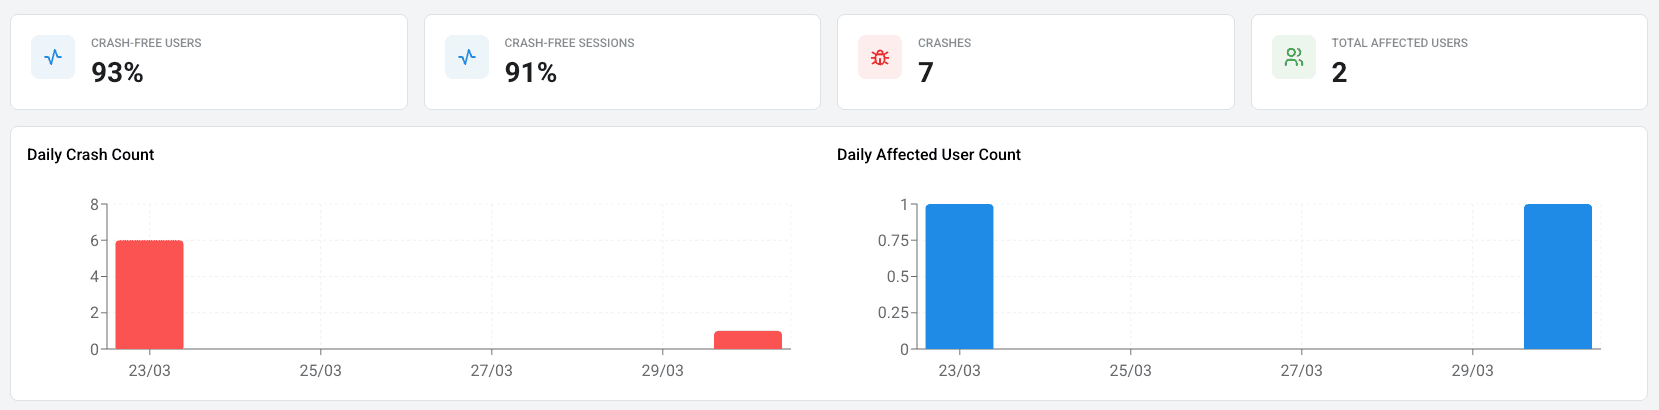
At the top of the page you’ll typically see health metrics and trend charts. Common metrics include:
- Crash-free users / sessions (%)
- Total crashes
- Affected users / sessions
- Daily trend charts to spot spikes
Screenshot: Crash overview metrics
4) Issue list (what each row means)
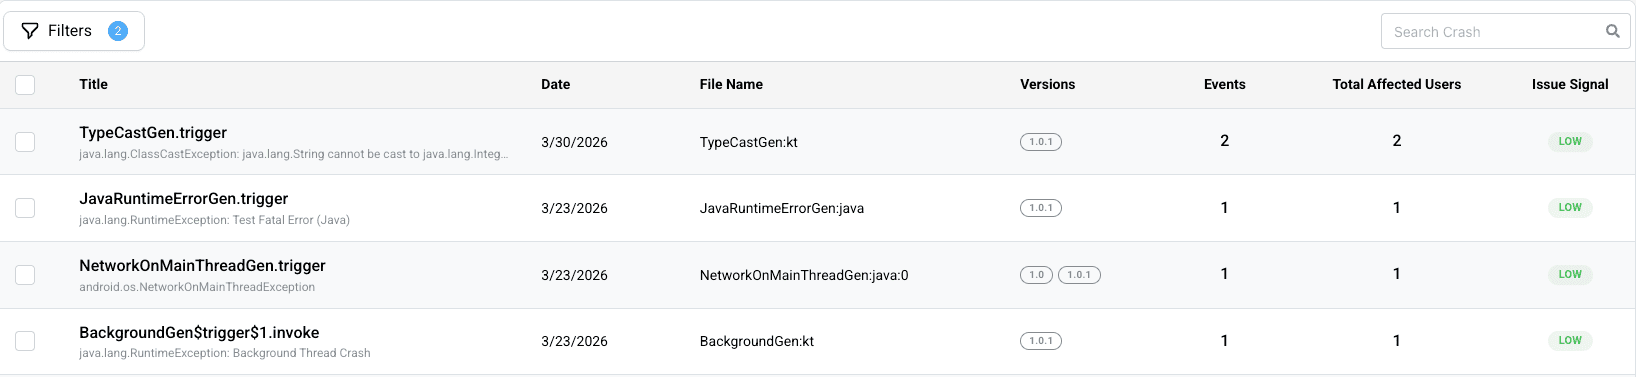
The crash list shows each crash issue with key indicators such as frequency and impact. Depending on configuration, rows may include:
- Issue title / exception signature
- First seen / Last seen
- Events (occurrence count)
- Affected users
- App/OS/Device context
- Issue signal (to indicate severity/priority)
Screenshot: Crash issues list
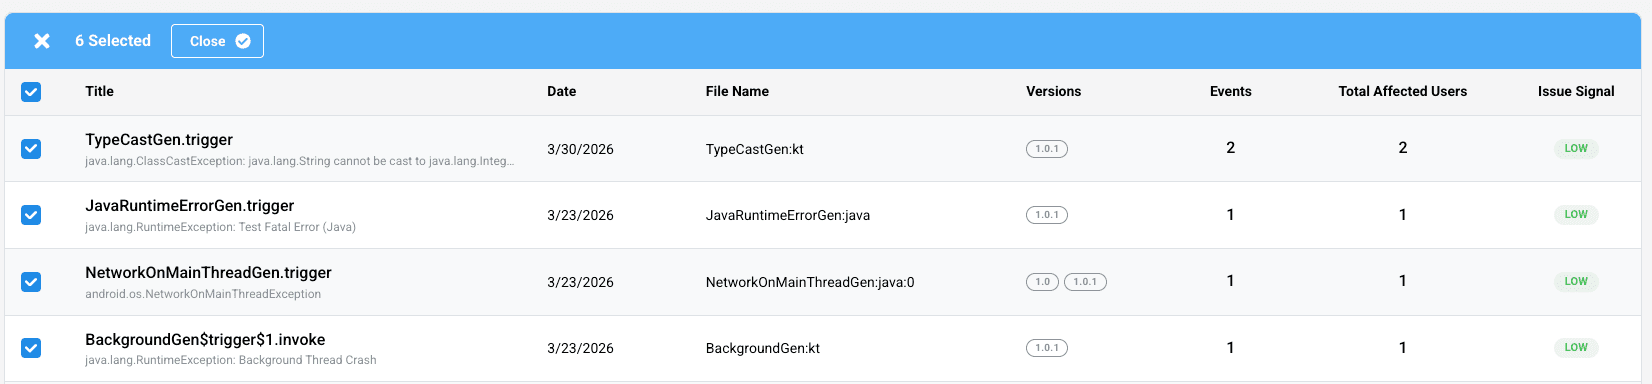
5) Bulk actions (Open / Close)
You can select one or multiple crash issues and update their status in bulk:
- Close an issue after it’s fixed or no longer relevant
- Re-open if the issue appears again or needs additional investigation
Screenshot: Bulk actions
Tip: Start with the highest-impact issues (most affected users / highest event count), then open Crash Detail to review AI analysis and stack traces.