.png)
HTTP Monitoring
Monitor API endpoints, performance, success/error rates, and drill into Endpoint Detail
HTTP Monitoring helps you analyze network traffic captured from devices: endpoint volume, success/error rates, and performance (response times). Use filters and search to isolate problematic endpoints, then open Endpoint Detail for request/response inspection.
1) Overview (what you see here)
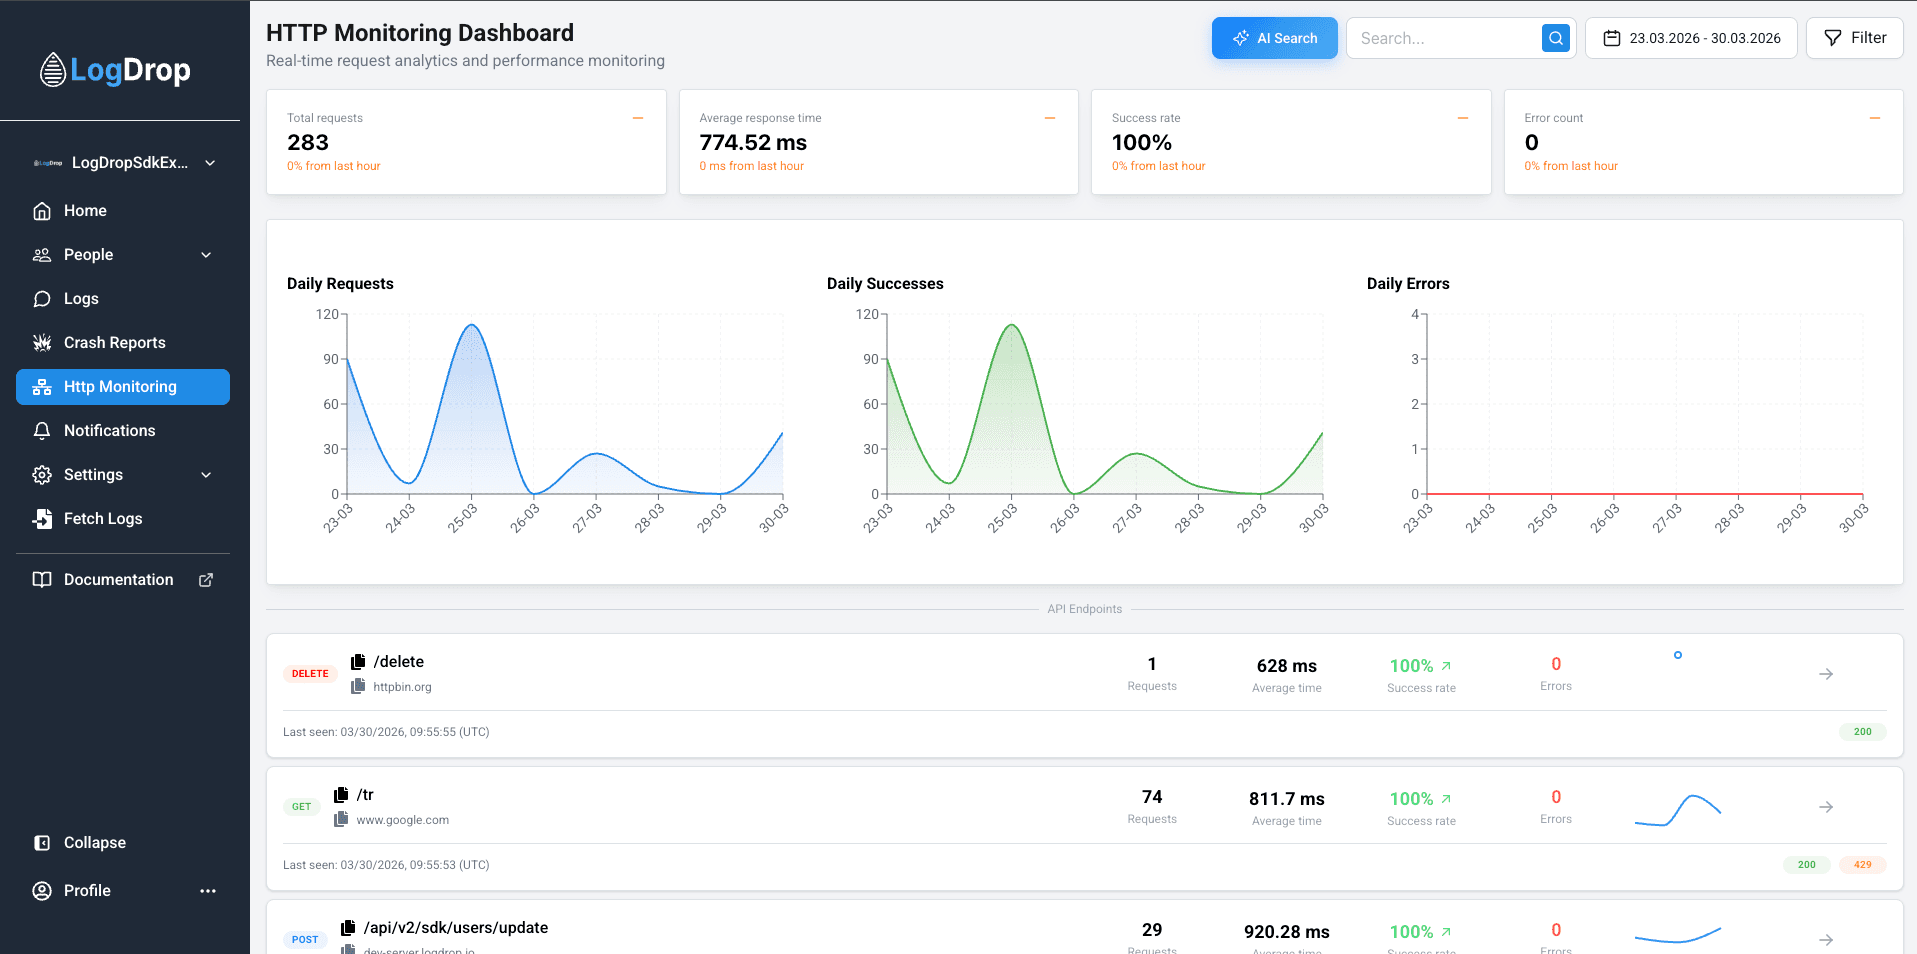
- Summary metrics (requests, success rate, avg response time, errors)
- Daily trend charts (requests / successes / errors)
- Endpoint list with method, URL/domain, counts, avg time, success rate, errors
- Ability to drill into a single endpoint/request in Endpoint Detail
Screenshot: HTTP Monitoring overview
2) Search (Endpoint-based)
Use search to quickly locate a specific endpoint or domain (e.g., /login, /payments,
or a host like api.yourdomain.com).
Screenshot: Search bar

3) AI Search (natural language)
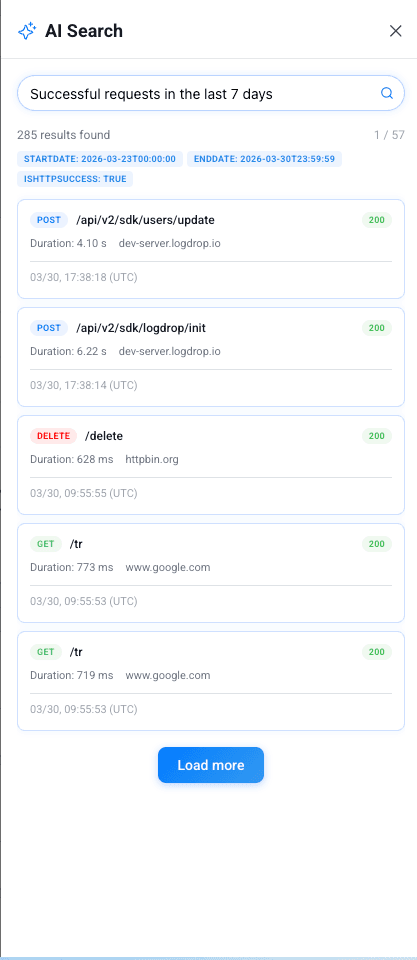
If AI Search is enabled, you can write a natural language query and the panel will help apply relevant filters. Example queries:
show failed requests for /login in last 24 hoursslow endpoints over 2 secondserrors on Android after version 1.2.3
Screenshot: AI Search
4) Filters
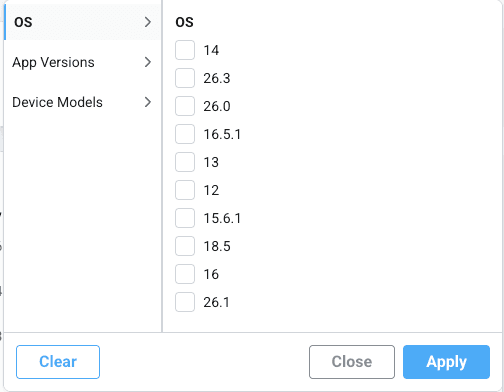
Filters help you isolate the affected cohort and reproduce issues faster.
- Date range (incident window / release window)
- Platform (iOS / Android / Huawei if applicable)
- App Version and OS Version
- Device Model and optionally Device UUID
- Status group (success vs error codes) if available
Screenshot: Filters section
5) Reading the endpoint list
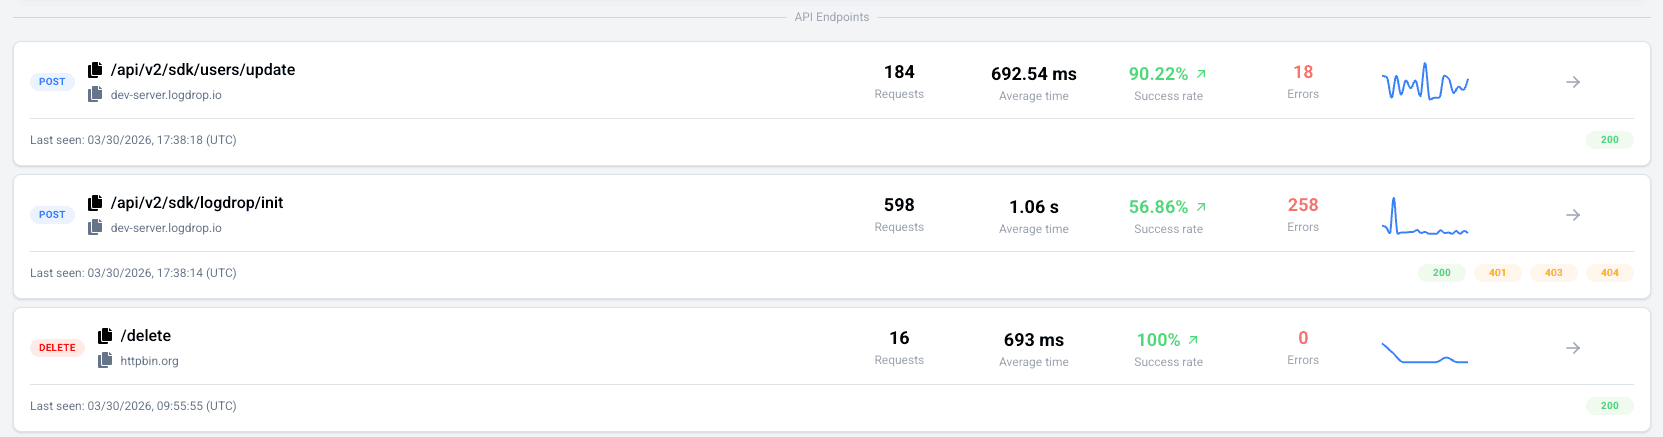
Each row typically aggregates one endpoint/method combination. You’ll commonly see:
- Method (GET/POST/etc.)
- Domain / URL
- Request count
- Average response time
- Success rate
- Error count
- A mini trend indicator (sparkline) where supported
Screenshot: Endpoint list
6) When to open Endpoint Detail
Open Endpoint Detail when you need to inspect the exact request/response:
- Investigating a specific error response (4xx/5xx)
- Validating headers (auth, content-type, SDK headers)
- Comparing request body vs server response body
- Correlating an HTTP event with a device’s logs
Tip: For end-to-end debugging, open the device in Device Detail and jump to HTTP/Logs for the same time window.