.png)
LogDrop Panel
Central guide for using LogDrop Panel (dashboard, devices, logs, crashes, HTTP, settings)
Welcome to the LogDrop Panel Documentation.
This guide helps you use the LogDrop panel to monitor crashes, logs, and HTTP traffic, and to configure security & operational settings.
Quick Start
- Login: Go to panel.logdrop.io and sign in with your panel credentials.
- Select a project: Choose the project you want to monitor.
- Start with Dashboard to get a health overview, then drill down into Devices, Logs, Crashes, or HTTP Monitoring.
If you’re new here: start from Getting Started.
Panel at a glance
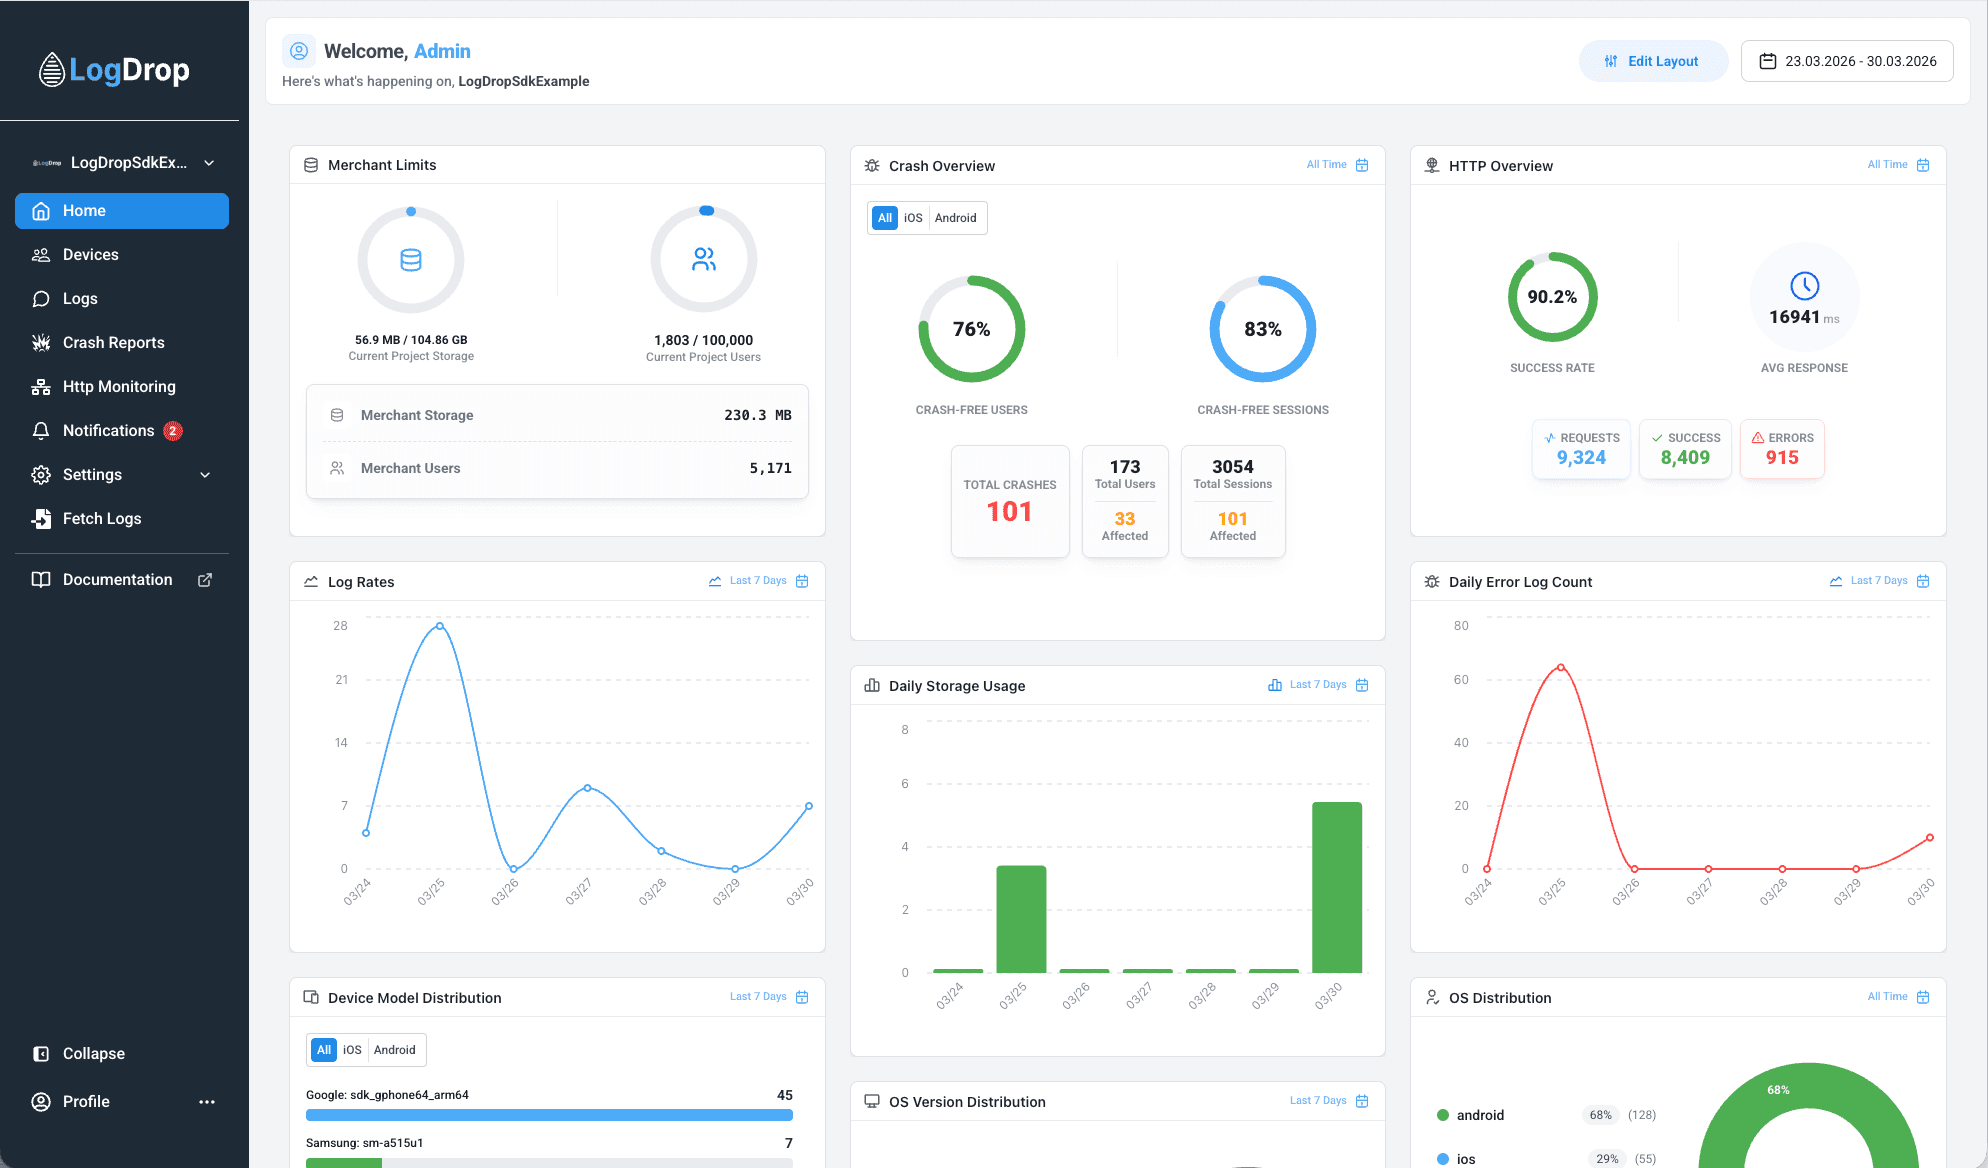
Documentation sections

Getting Started
Access, login, invitations, authorization, and project selection.

Dashboard
Monitor key metrics with widgets, filters, and platform breakdown.

Devices
Explore device lists, filters, and drill into device-level details.

Logs
Search, filter, download logs, and inspect detailed log lines.

Crashes
Track issues, affected users, AI summaries, and stack traces.

HTTP Monitoring
Analyze endpoints, response times, success rate, and errors.

Anomaly Detection
AI-powered anomaly detection across crashes, network, performance, and logic issues.

Notifications
Review alerts by severity and manage unread/system notifications.
Push Notification
Send standard push notifications, in-app messages, and deep links to app users, and track delivery analytics.

Settings
Users, API key, Remote Config, integrations, access control, push backends.
Fetch Logs
Trigger real-time log collection for all devices or a specific device UUID.