.png)
Crash Detail
Analyze a single crash issue with AI summary, impact metrics, event details, and stack trace
Crash Detail is the deep-dive view for a single crash issue. It shows impact metrics, trends, event-level context, an AI analysis summary (if enabled), and the stack trace to help you identify root cause and fix faster.
1) Header (Issue identity)
The header typically includes the crash title/signature, exception type, status (Open/Closed), issue signal, and sometimes a source file reference.
Screenshot: Crash Detail header

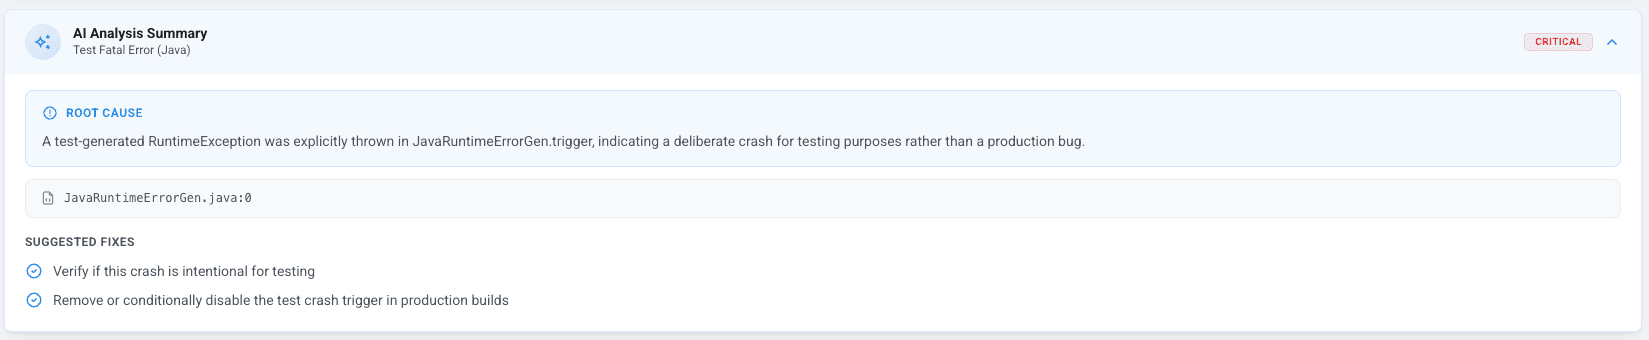
2) AI Analysis Summary
If AI analysis is enabled, this section summarizes the likely cause and suggests potential remediation steps. Treat it as a helper: validate against the stack trace and your codebase.
Screenshot: AI summary
3) Impact metrics
Use impact metrics to prioritize. Common fields include:
- Affected users
- Total events (occurrences)
- First seen / Last seen
Screenshot: Impact metrics

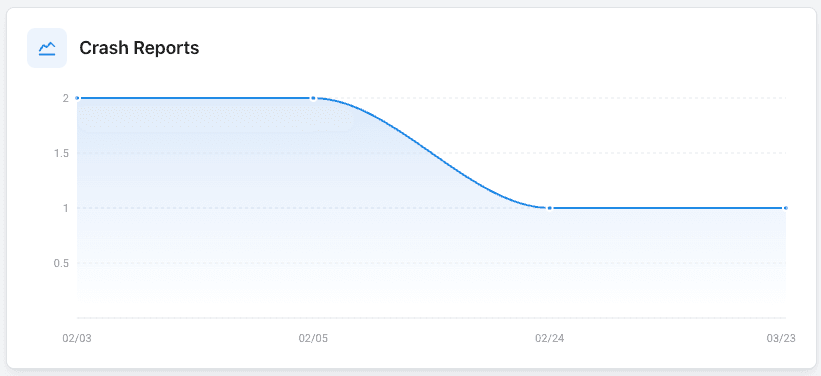
4) Trends & distributions
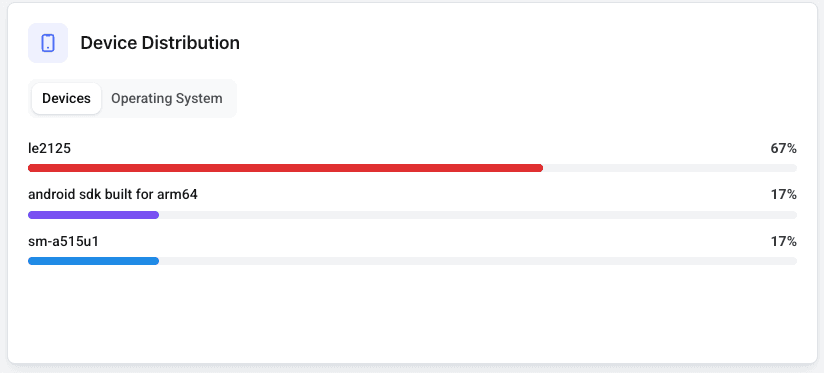
Charts help you identify whether the crash is growing, stable, or tied to specific segments. Common breakdowns include device model, OS version, and app version.
Screenshot: Trend chart
Screenshot: Distribution breakdowns
5) Event details (single occurrence context)
Each event represents a single crash occurrence. Event details help you reproduce and debug the issue. Typical fields include:
- App Version, OS Version, Device Model
- Timestamp and Time in session (if available)
- App state (foreground/background) if available
- Flow UUID, Device UUID
- Navigation between events (previous/next)
Screenshot: Event list / event detail

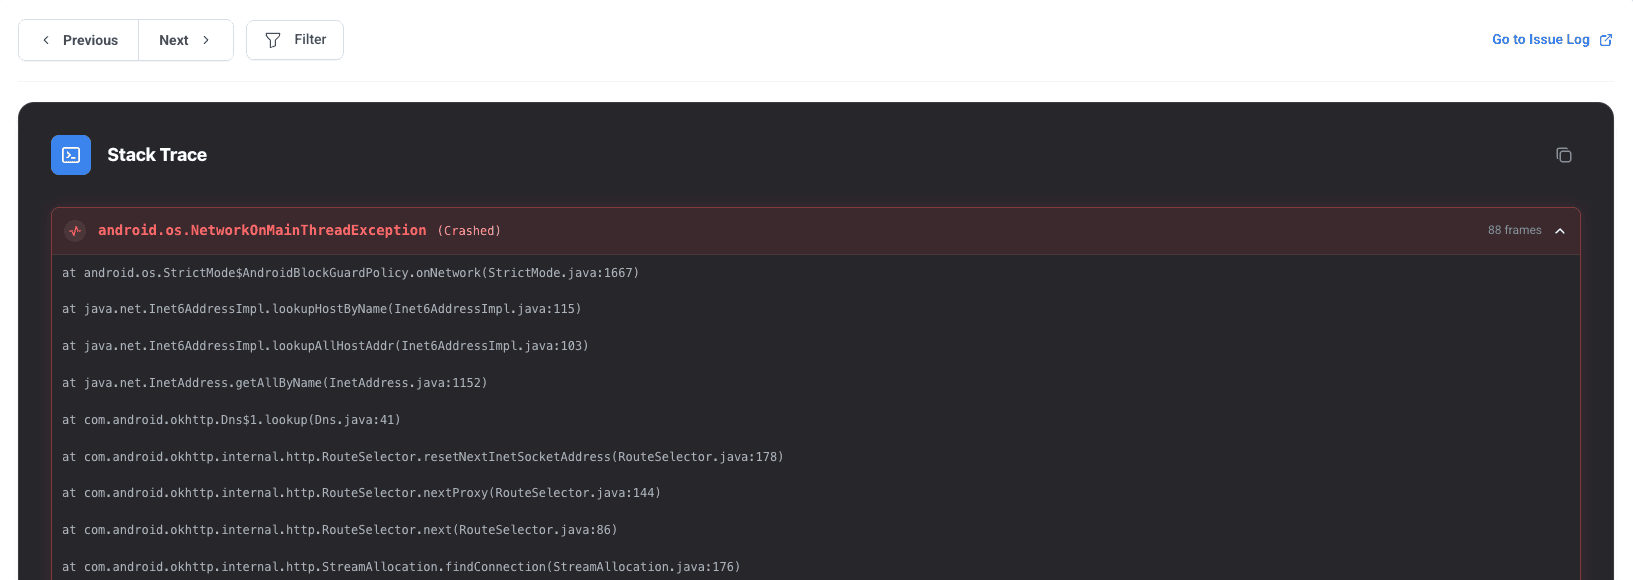
6) Stack trace
The stack trace is the primary source of truth for debugging. Start from the top-most relevant application frames, then correlate with logs and recent deployments.
Screenshot: Stack trace
Tip: After identifying the suspected root cause, confirm by checking Log Detail for the same device/time window and by correlating with the Dashboard trend.