.png)
PanelAnomaly detection
Anomalies
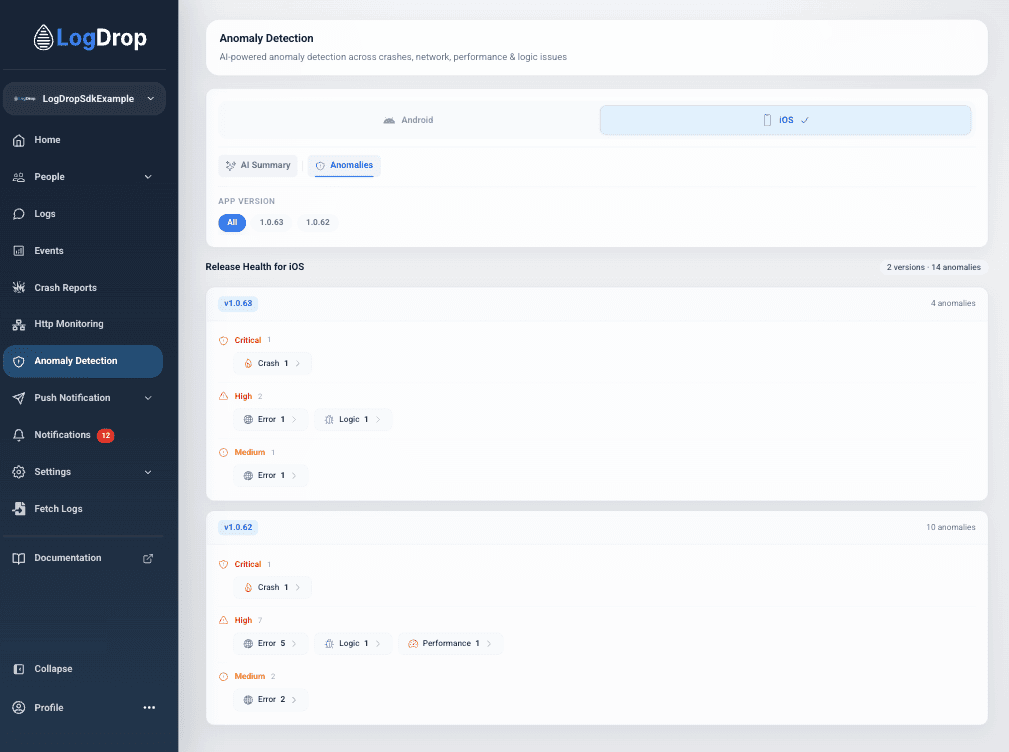
Review app anomalies grouped by version and categorized by severity levels
The Anomalies tab lists all active incidents and anomalies detected across your app versions. It categorizes issues by severity and anomaly type, giving developers a structured list to prioritize work.
1) App Version Grouping
Anomalies are grouped by app version so you can easily isolate regressions in new releases from legacy issues in older deployments.
2) Severity Categorization
Within each app version, detected anomalies are organized into three severity tiers:
- Critical – Reserved for issues with severe user impact, primarily fatal application crashes (e.g.,
Crash). - High – Non-fatal issues that severely impact usability or core functionality, such as failed push notifications, missing configurations, or major performance bottlenecks (e.g.,
Logic,Error,Performance). - Medium – Minor errors, warnings, or anomalies that do not break main user flows but should be addressed (e.g., secondary network errors or UI logic warnings).
3) Anomaly Type Pills
Issues are represented by type pills that display the count of active incidents of that type:
- Crash – Application crashes and uncaught exceptions.
- Error – Network response failures, file IO issues, or API errors.
- Logic – Missing variables, configuration inconsistencies, or logic path failures (e.g.,
APNs Registration Configuration Failure). - Performance – App lag, slow responses, database query slowdowns, or rendering delays.
Clicking on any anomaly pill opens the detailed list and lets you navigate to the Anomaly Detail page.
Screenshot: Anomaly Detection list