.png)
Anomaly Detail
Deep-dive into a single anomaly with metrics, AI root cause analysis, affected devices, and log mappings
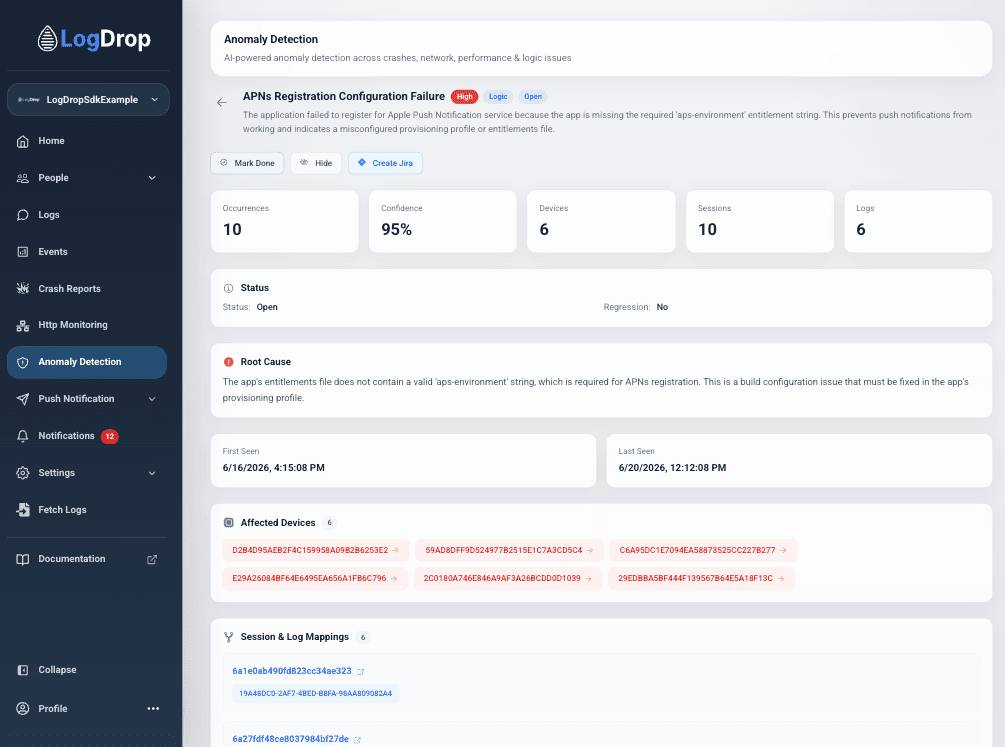
Anomaly Detail is the diagnostic dashboard for a single detected incident. It provides impact metrics, AI-generated root cause analysis, first/last seen timestamps, and direct mappings to affected device UUIDs and raw session logs.
1) Header & Actions
The header contains key categorization tags and action items to manage the anomaly's lifecycle:
- Tags – Displays the anomaly title (e.g.,
APNs Registration Configuration Failure), severity (e.g.,High), category (e.g.,Logic), and status (e.g.,Open). - Mark Done – Resolves the anomaly and removes it from the active list.
- Hide – Silences notifications for the anomaly without marking it as resolved.
- Create Jira – Instantly exports the anomaly's context, metrics, and root cause to a new Jira ticket.
2) Impact Metrics Grid
Summary statistics help you understand the depth of the issue's impact across your user base:
- Occurrences – The total count of times this anomaly was triggered.
- Confidence – The statistical confidence level of the detection model (e.g.,
95%). - Devices – The number of unique devices affected.
- Sessions – The number of user sessions impacted.
- Logs – The count of log files containing traces of this anomaly.
3) Status & Timeline
Indicates regression indicators and the historical timeline of the anomaly:
- Status – Current resolution state (
Open/Closed). - Regression – Displays
Yesif this issue was previously resolved but has re-appeared in a newer release. - First Seen – Timestamp of the first recorded occurrence.
- Last Seen – Timestamp of the most recent occurrence.
4) Root Cause Analysis
An AI-generated diagnosis of why the anomaly occurred and how to fix it. In the example of an APNs configuration failure, it details that the entitlements file is missing a valid aps-environment string and points the developer to provisioning profiles.
5) Affected Devices
A list of clickable device UUID links running on the impacted version. Clicking a device link navigates to the Device Detail page to review hardware specifications and logs.
6) Session & Log Mappings
Direct links to the exact sessions and raw log files where the anomaly occurred. This lets developers jump straight from the high-level anomaly down to the line of code that triggered it in the raw logs.
Screenshot: Anomaly Detail overview