.png)
Log Detail
Inspect logs line-by-line, filter by level/flow/date, and use advanced search operators
Log Detail is where you inspect logs line-by-line. Use level filters, flow filtering, date range, and search operators to isolate the exact sequence that caused an issue.
1) Header (Device UUID / User UUID)
At the top of the page you’ll typically see identifiers such as Device UUID and User UUID. These help you confirm you’re analyzing the correct device/user context.
Screenshot: Log Detail header

2) Log level filters
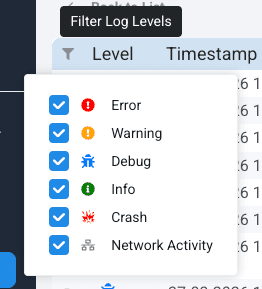
Use level filters to focus on the signal you need. Common levels include: Error, Warning, Info, Debug, Crash, and Network Activity.
Screenshot: Log level filter
3) Device info at log time (context shortcuts)
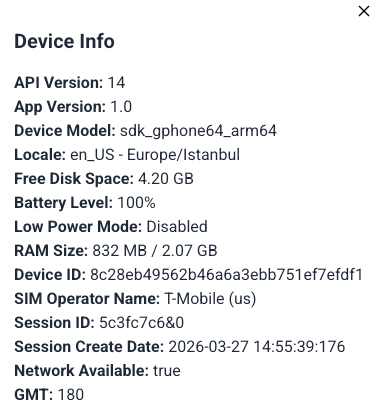
Some UI elements allow you to open device context at the moment a log line was generated. This helps correlate state (app/OS/version) with the log entry.
Screenshot: Context shortcuts
4) Sorting & time alignment
Sorting supports ascending/descending order. Note that timestamps may reflect device time vs server time depending on configuration; use sorting and date filters to align the session timeline correctly.
Screenshot: Sorting controls

5) Log tools
- Refresh to load latest entries
- Scroll to top/bottom shortcuts
- Sort ASC/DESC
- Download Logs for offline analysis
Screenshot: Log tools toolbar

6) Pinning log lines
Pin a log line to keep it visible while you navigate other entries. This is useful when comparing a key error line against related lines across the timeline.
Screenshot: Pin log line
7) Resizing & expanded view
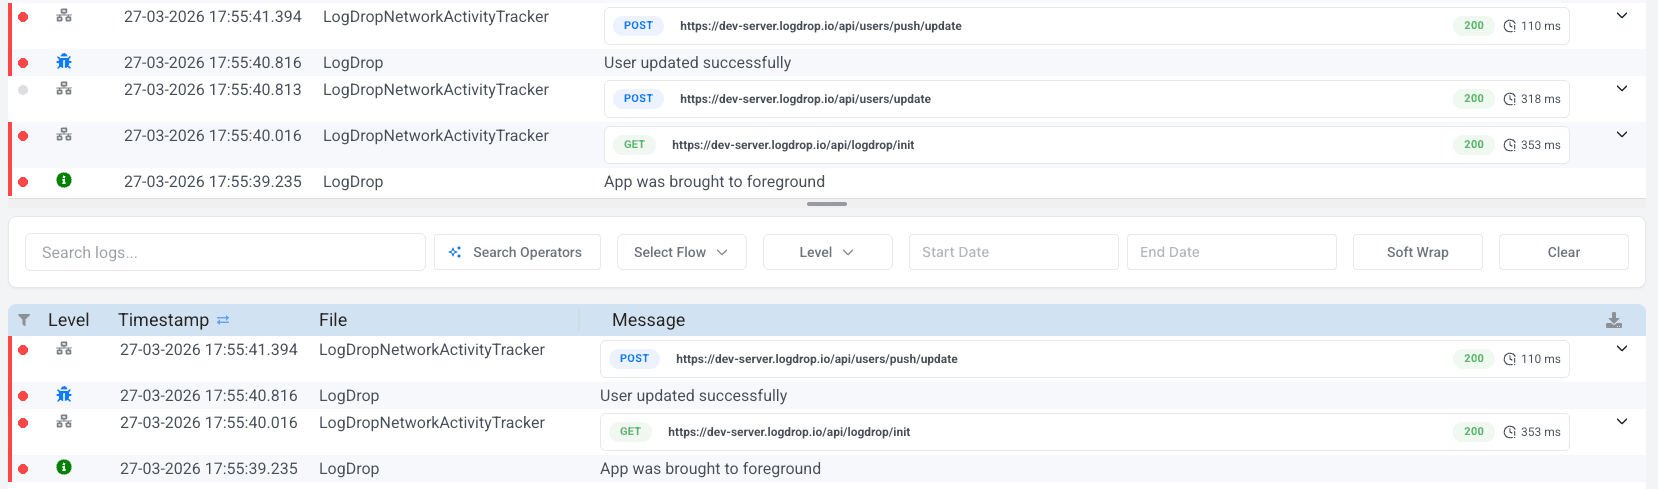
You can resize areas between the main list and filtered/detail panels (if available). Long messages (stack traces, JSON) can be expanded for readability.
Screenshot: Expand long line / resize areas

8) Advanced search
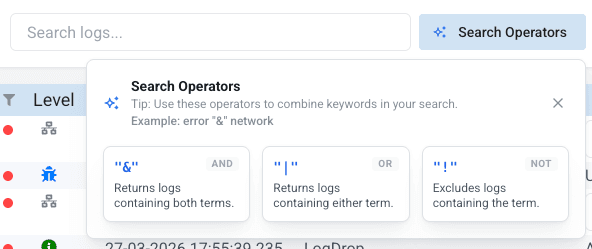
Use search to find specific errors, endpoints, or flows. Supported operators:
- AND using
&(example:timeout & login) - OR using
|(example:crash | exception) - NOT using
!(example:error & !retry)
Screenshot: Search bar & operators
9) Additional filters (Flow / Date / Soft wrap)
Depending on your configuration, you may also have filters such as:
- Flow (group log lines by a flow/session identifier)
- Start/End date to narrow down the log timeline
- Soft wrap for long lines
Screenshot: Additional filters

Tip: When debugging, start with Error + Crash filters, then narrow down using Flow and search operators.